Smart Highlights - Essential Conditional Formatting Made Easy
Data Analysis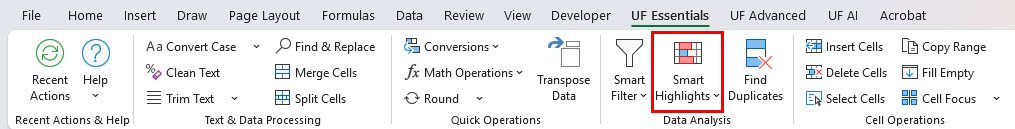
Smart Highlights brings professional-grade conditional formatting to your fingertips with an organized, easy-to-use system. Instead of struggling with Excel’s complex conditional formatting dialogs, you can apply essential highlighting rules with a single click. I’ve organized the most commonly needed formatting rules into logical categories, making it simple to enhance your data’s visual impact and analytical power.
We know how time-consuming it can be to set up conditional formatting rules manually. Maybe you need to quickly highlight duplicate values for review, or you want to make blank cells stand out for data entry. Smart Highlights eliminates the complexity and gives you instant, professional results.
Key Benefits
How to Use
Using Smart Highlights is incredibly simple:
- Select your data range that you want to format
- Go to UF Essentials tab → Data Analysis group
- Click Smart Highlights to open the menu
- Choose your highlighting rule from the organized categories
- See instant results with professional formatting applied
For text-based highlights (Contains, Begins With, Ends With), you’ll be prompted to enter the specific text to search for.
Examples
Example 1: Customer Database Cleanup
Scenario: You have a customer list and need to identify duplicates and missing information.
Steps:
- Select your customer data range
- Apply “Duplicates” highlight to identify duplicate customers
- Apply “Blank Cells” highlight to find missing contact information
- Review highlighted cells and clean up data accordingly
Example 2: Sales Report Analysis
Scenario: You want to highlight all sales containing “Premium” products and identify weekend sales.
Steps:
- Select your sales data
- Choose “Contains Text…” and enter “Premium”
- Select your date column
- Apply “Weekend Dates” highlight
- Analyze patterns in premium weekend sales
Example 3: Financial Model Review
Scenario: You need to check a financial model for errors and identify unique account codes.
Steps:
- Select your entire model range
- Apply “Errors” highlight to find formula problems
- Select your account code column
- Apply “Unique Values” highlight to identify special accounts
- Review and validate highlighted items
Example 4: Project Timeline Validation
Scenario: You want to highlight current month deadlines and identify incomplete tasks.
Steps:
- Select your deadline column
- Apply “This Month” highlight to show current month deadlines
- Select your status column
- Apply “Blank Cells” highlight to find incomplete status entries
- Focus on highlighted items for immediate attention
Available Filter Types
Data Quality Highlights
Essential tools for data validation and quality control:
- Duplicates: Highlight cells that contain duplicate values within the selected range
- Unique Values: Highlight cells that contain unique values within the selected range
- Blank Cells: Highlight empty cells within the selected range
- Errors: Highlight cells containing formula errors (#N/A, #VALUE!, #REF!, etc.)
Text Analysis Highlights
Powerful text pattern recognition for content analysis:
- Contains Text…: Highlight cells containing specific text (you’ll be prompted to enter the text)
- Begins With…: Highlight cells that begin with specific text (you’ll be prompted to enter the starting text)
- Ends With…: Highlight cells that end with specific text (you’ll be prompted to enter the ending text)
Date Intelligence Highlights
Smart date-based formatting for time-sensitive data:
- Weekend Dates: Highlight cells containing Saturday or Sunday dates
- This Month: Highlight cells containing dates from the current month
Management Tools
Control and customize your highlighting:
- Clear All Highlights: Remove all conditional formatting from the selected range
- Manage Rules…: Open Excel’s conditional formatting rules manager
- Customize Colors…: Open the color settings panel to customize highlight colors
Customization Options
Color Customization
Access the color settings panel to:
- Choose from professional color palettes
- Create custom color schemes for your organization
- Set default colors for different highlight types
- Save color preferences across Excel sessions
Rule Management
Use the “Manage Rules” option to:
- View all applied conditional formatting rules
- Modify existing highlighting rules
- Delete specific rules while keeping others
- Create complex custom formatting scenarios
Integration with Other Features
Smart Filter Combination
- Filter data first, then apply highlights to filtered results
- Use highlights to identify patterns, then filter to focus on highlighted items
- Create powerful analytical workflows combining filtering and highlighting
Find Duplicates Enhancement
- Use duplicate highlighting for quick visual identification
- Combine with Find Duplicates tool for comprehensive duplicate management
- Apply highlights before using advanced duplicate analysis features
Report Generation
- Use highlights to create visually appealing reports
- Combine with Export Studio for formatted data export
- Perfect for creating presentation-ready data visualizations
Troubleshooting
Common Issues
- Highlights not appearing: Verify you’ve selected the correct data range
- Unexpected highlighting: Check for hidden characters or formatting in your data
- Performance slowdown: Clear unused highlights and avoid overlapping rules
- Color not visible: Try different highlight colors or check display settings
Optimization Tips
- Apply highlights to specific ranges rather than entire worksheets
- Clear unused conditional formatting rules regularly
- Use “Clear All Highlights” to reset before new analysis
- Test highlighting on small data samples first
Common Use Cases
Data Quality Control
- Duplicate Detection: Quickly identify duplicate entries in customer lists, inventory, or any dataset
- Completeness Check: Use blank cell highlighting to find missing required information
- Error Identification: Spot formula errors immediately for troubleshooting and correction
- Unique Value Analysis: Identify unique entries for special handling or analysis
Content Analysis
- Keyword Highlighting: Find all cells containing specific terms, codes, or categories
- Pattern Recognition: Identify entries that begin or end with specific patterns
- Content Validation: Ensure data follows expected naming conventions or formats
- Text Mining: Extract insights from large text datasets by highlighting key terms
Time-Based Analysis
- Weekend Planning: Identify weekend dates for scheduling and resource planning
- Current Period Focus: Highlight current month data for period-specific analysis
- Date Validation: Ensure date entries fall within expected ranges or patterns
- Temporal Patterns: Identify time-based trends and patterns in your data
Report Preparation
- Executive Summaries: Highlight key metrics and important values for leadership review
- Exception Reporting: Make outliers and unusual values stand out for investigation
- Presentation Ready: Create visually appealing reports that communicate insights clearly
- Audit Trails: Mark reviewed, approved, or flagged items for audit purposes
Frequently Asked Questions
Yes! Use the “Customize Colors…” option to open the color settings panel where you can choose your preferred colors for different highlight types.
Smart Highlights adds new conditional formatting rules. Existing rules are preserved, but conflicting rules may override each other based on priority.
Yes, you can apply multiple Smart Highlights to the same data. Excel will layer the formatting rules according to their priority.
This removes ALL conditional formatting from the selected range, including any existing rules you may have created manually.
Yes, Smart Highlights use Excel’s conditional formatting, so they will appear in printed documents and PDF exports.
Yes, use “Manage Rules…” to open Excel’s conditional formatting manager where you can edit, delete, or reorder any formatting rules.
Related Documentation
Smart Filter - Advanced Data Filtering Made Simple
Filter Excel data by formatting, content type, and patterns. Show bold text, for...
Read DocumentationFind Duplicates - Comprehensive Duplicate Detection & Management
Find, highlight, hide, and manage duplicate data in Excel with advanced detectio...
Read Documentation