Cell Focus - Visual Navigation Enhancement
Cell Operations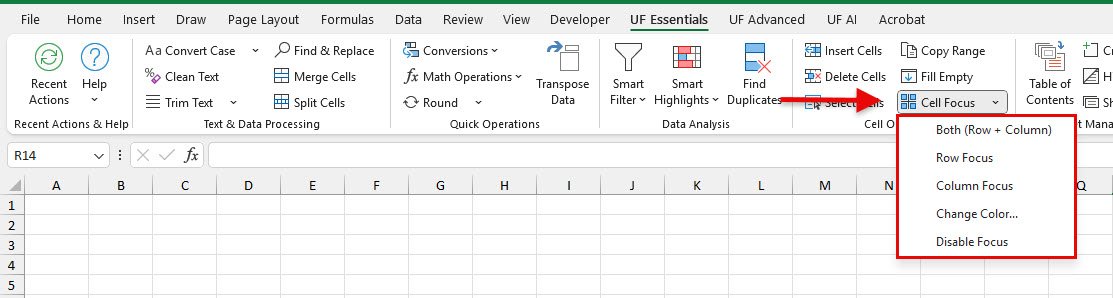
Cell Focus transforms how you navigate and work with Excel data using an intelligent highlighting system that follows your selection. Whether you need to track row relationships, follow column data, or maintain visual context while working with large spreadsheets, I provide you with professional-grade visual enhancement tools that make data navigation effortless.
We know how easy it is to lose your place in large spreadsheets or struggle to follow data relationships across rows and columns. Maybe you’re working with a complex financial model or analyzing a large dataset where keeping track of related information is crucial. Cell Focus eliminates this confusion by providing dynamic visual context that moves with your selection.
Key Benefits
How to Use
Basic Focus Activation
- Go to UF Essentials tab → Cell Operations group
- Click Cell Focus to toggle highlighting on/off
- Select any cell to see row/column highlighting
- Move around and watch highlighting follow your selection
Choosing Focus Modes
- Click the Cell Focus dropdown arrow
- Select your preferred mode:
- Both (Row + Column) - Default mode
- Row Focus - Horizontal highlighting only
- Column Focus - Vertical highlighting only
- Highlighting updates immediately to your chosen mode
Customizing Colors
- Click Cell Focus dropdown → Change Color
- Choose your preferred color from the color picker
- See preview of your color choice
- Click OK to apply the new color
- Color persists across all Excel sessions
Examples
Example 1: Financial Model Navigation
Scenario: You’re working with a complex financial model and need to track relationships between revenue drivers and calculations.
Steps:
- Enable Cell Focus with “Both” mode
- Click on a revenue cell
- See the entire row and column highlighted
- Easily trace data relationships across the model
Example 2: Data Entry Verification
Scenario: You’re entering customer data and need to ensure information aligns across columns.
Steps:
- Set Cell Focus to “Row Focus” mode
- Select customer name cell
- Entire customer row is highlighted
- Verify all customer information is consistent across columns
Example 3: Large Dataset Analysis
Scenario: You’re analyzing a large sales dataset and need to follow specific product performance across time periods.
Steps:
- Use “Column Focus” mode
- Click on a product column
- Entire product column is highlighted
- Easily track product performance without losing your place
Example 4: Report Review
Scenario: You’re reviewing a quarterly report and need to check calculations across multiple sections.
Steps:
- Enable “Both” mode with a subtle highlight color
- Navigate through report sections
- Visual highlighting helps maintain context
- Quickly spot relationships and verify calculations
Key Features
Focus Modes
- Both (Row + Column): Highlight entire row and column, excluding the selected cell
- Row Focus: Highlight the entire row of the selected cell
- Column Focus: Highlight the entire column of the selected cell
- Toggle On/Off: Instantly enable or disable focus highlighting
Visual Customization
- Custom Colors: Choose your preferred highlight color
- Professional Palette: Default colors optimized for readability
- High Contrast: Colors designed for accessibility and print compatibility
- Persistent Settings: Your color preferences are saved across sessions
Smart Highlighting
- Dynamic Updates: Highlighting follows your selection automatically
- Active Cell Exclusion: Selected cell remains unhighlighted for clarity
- Multi-Range Support: Works with complex selections and ranges
- Performance Optimized: Smooth highlighting even with large datasets
Easy Management
- Quick Toggle: Enable/disable with single click
- Mode Switching: Change focus modes without turning off
- Color Picker: Visual color selection with preview
- Reset Options: Return to default settings anytime
Advanced Usage Scenarios
Data Analysis Workflows
- Correlation tracking: Use Both mode to see row/column relationships
- Trend analysis: Column focus for time-series data review
- Record validation: Row focus for complete record verification
- Cross-reference checking: Dynamic highlighting for lookup validation
Large Spreadsheet Navigation
- Context maintenance: Never lose your place in large datasets
- Relationship tracking: Visual connections between related data
- Section navigation: Clear visual boundaries between data sections
- Multi-user collaboration: Enhanced visibility during screen sharing
Professional Presentation
- Client demonstrations: Clear visual focus during presentations
- Training sessions: Enhanced visibility for instructional purposes
- Audit reviews: Professional highlighting during data reviews
- Report walkthroughs: Clear visual guidance through complex reports
Best Practices
Choosing Focus Modes
- Both mode: Best for general navigation and relationship tracking
- Row focus: Ideal for record-based data and horizontal analysis
- Column focus: Perfect for time-series data and vertical analysis
- Toggle off: Disable when highlighting becomes distracting
Color Selection
- Subtle colors: Choose colors that enhance without overwhelming
- Contrast consideration: Ensure good contrast with your data
- Print compatibility: Test colors for printed document appearance
- Team consistency: Coordinate colors in collaborative environments
Workflow Integration
- Enable for analysis: Turn on during data analysis sessions
- Disable for entry: Turn off during intensive data entry
- Presentation mode: Use during client presentations and training
- Review sessions: Enable for systematic data review processes
Advanced Customization
Color Psychology
- Blue tones: Professional, calming, good for extended use
- Green tones: Easy on eyes, good for data entry sessions
- Yellow tones: High visibility, good for presentations
- Gray tones: Subtle, professional, good for print documents
Workflow Optimization
- Task-based colors: Different colors for different types of work
- Team coordination: Standardized colors across team members
- Document types: Specific colors for different document types
- Accessibility: High contrast options for visual accessibility needs
Professional Settings
- Client work: Subtle, professional colors for client-facing work
- Internal analysis: Brighter colors for internal data analysis
- Training materials: High contrast colors for instructional content
- Audit documentation: Professional colors for audit trail visibility
Integration with Other Features
Data Analysis Enhancement
- Combine with Smart Highlights: Use focus for navigation, smart highlights for analysis
- Coordinate with Select Cells: Focus on selected areas for better visibility
- Integrate with Smart Filter: Visual context while applying filters
- Support Find Duplicates: Enhanced visibility during duplicate analysis
Navigation Workflows
- Sheet Management: Focus helps navigate complex multi-sheet workbooks
- Formula Tools: Visual context while working with formulas
- Cell Operations: Enhanced visibility during cell manipulation
- Professional presentation: Clear visual guidance during demonstrations
Related Documentation
Insert Cells - Advanced Cell, Row, and Column Insertion
Insert cells, rows, and columns in Excel with advanced options. Shift cells, ins...
Read DocumentationDelete Cells - Advanced Cell, Row, and Column Deletion
Delete cells, rows, and columns in Excel with advanced options. Remove blank row...
Read DocumentationSelect Cells - Advanced Cell Selection with Criteria
Select Excel cells by content type, conditions etc. Find blank cells, formulas,...
Read Documentation