Smart Filter - Advanced Data Filtering Made Simple
Data Analysis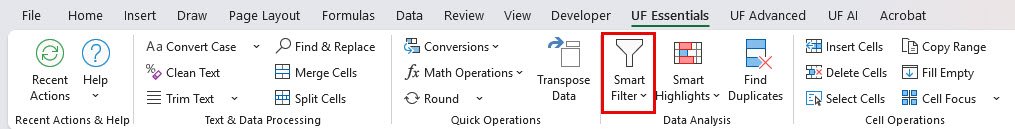
Smart Filter revolutionizes how you work with Excel data by providing intelligent filtering options that go far beyond Excel’s standard filters. Instead of manually setting up complex filter criteria, you can instantly filter your data based on formatting (bold, italic), content type (formulas, numbers, text), and data patterns (blanks, non-blanks) with a single click.
I know how frustrating it can be to manually identify specific types of data in large spreadsheets. Maybe you need to find all cells with formulas for auditing, or you want to see only bold-formatted entries for review. Smart Filter eliminates this tedious work by providing instant, intelligent filtering that understands your data’s characteristics.
Key Benefits
How to Use
Using Smart Filter is incredibly straightforward:
- Select a cell in the column you want to filter
- Go to UF Essentials tab → Data Analysis group
- Click Smart Filter to open the filter menu
- Choose your filter type from the organized categories
- View filtered results instantly
The filter automatically applies to your data table, showing only rows that match your criteria.
Examples
Example 1: Financial Model Audit
Scenario: You’re auditing a financial model and need to review all formula cells.
Steps:
- Click on any cell in your data range
- Open Smart Filter menu
- Select “Formulas” from Content Type Filters
- Review all formula cells that are now visible
- Use “Clear All Filters” when done
Example 2: Data Entry Validation
Scenario: You need to find all empty cells in a customer database.
Steps:
- Select a cell in the column you want to check
- Choose “Blank Cells” from Data Pattern Filters
- See all rows with missing data in that column
- Fill in missing information as needed
- Clear filters to see complete dataset
Example 3: Formatting Consistency Check
Scenario: You want to ensure all headers are properly formatted in bold.
Steps:
- Click in your header column
- Select “Bold Text” from Formatting Filters
- Verify all important headers are showing
- Switch to “Non-Bold Text” to find unformatted headers
- Apply bold formatting to any missed headers
Example 4: Report Data Cleanup
Scenario: You need to show only complete records for a client report.
Steps:
- Select a key column that should never be empty
- Choose “Non-Blank Cells” from Data Pattern Filters
- Export or copy the filtered complete records
- Use this clean dataset for your report
Available Filter Types
Formatting Filters
Perfect for finding data based on visual formatting:
- Bold Text: Show only rows with bold formatted text in the selected column
- Non-Bold Text: Show only rows with regular (non-bold) text
- Italic Text: Show only rows with italic formatted text
- Non-Italic Text: Show only rows with regular (non-italic) text
Content Type Filters
Identify data based on what type of content it contains:
- Formulas: Show only rows containing formulas in the selected column
- Values Only: Show only rows with static values (no formulas)
- Numbers: Show only rows with numeric values
- Text: Show only rows with text values
Data Pattern Filters
Find patterns in your data structure:
- Blank Cells: Show only rows with empty cells in the selected column
- Non-Blank Cells: Show only rows with data in the selected column
Filter Management
- Clear All Filters: Remove all applied filters and show all rows
Integration with Other Features
Combine with Smart Highlights
- Use Smart Filter to isolate data, then apply Smart Highlights for visual emphasis
- Create powerful data analysis workflows by combining filtering and highlighting
- Perfect for creating presentation-ready data views
Work with Find Duplicates
- Filter data first, then run duplicate analysis on filtered results
- Use formatting filters to find duplicates in specific formatted ranges
- Combine for comprehensive data quality analysis
Enhance with Cell Operations
- Filter to specific data types, then apply cell operations to filtered results
- Use with Copy Range to extract filtered data to new locations
- Perfect for data preparation workflows
Troubleshooting
Common Issues
- No results showing: Check if your data actually contains the filtered criteria
- Filter not working: Ensure you’ve selected a cell within your data range
- Unexpected results: Verify your data doesn’t have hidden formatting or characters
- Performance issues: Clear filters between operations on very large datasets
Filter Tips
- Click directly in the column you want to filter
- Use “Clear All Filters” to reset and start fresh
- Check for merged cells that might affect filtering
- Ensure your data range is properly formatted as a table
Common Use Cases
Spreadsheet Auditing
- Find all formulas: Use “Formulas” filter to identify calculated cells for review
- Locate hardcoded values: Use “Values Only” filter to find static entries that might need updating
- Check formatting consistency: Use bold/italic filters to ensure consistent formatting
- Identify data gaps: Use “Blank Cells” filter to find missing information
Data Quality Control
- Validate data entry: Use “Numbers” or “Text” filters to ensure correct data types
- Find incomplete records: Use “Blank Cells” filter to locate missing required fields
- Check formatting standards: Use formatting filters to ensure compliance with style guides
- Identify outliers: Combine filters to isolate unusual data patterns
Report Preparation
- Extract key information: Use bold text filter to show highlighted important data
- Separate calculated vs. input data: Use formula filters to distinguish between calculations and inputs
- Clean data presentation: Use non-blank filters to show only complete records
- Format verification: Ensure consistent formatting before finalizing reports
Data Analysis Workflows
- Focus on specific data types: Filter by numbers for numerical analysis
- Isolate text entries: Filter by text for content analysis
- Find calculation errors: Use formula filters to review all calculated fields
- Identify data patterns: Use blank/non-blank filters to understand data completeness
Frequently Asked Questions
Yes, you can apply Smart Filters sequentially. Each new filter works on the currently visible (filtered) data, allowing you to create complex filtering scenarios.
Absolutely! Smart Filter works seamlessly with both regular ranges and Excel tables, automatically detecting your data structure.
Smart Filter works on visible data only. If you have manually hidden rows, they won’t be affected by the filtering operations.
Smart Filter can work with merged cells, but results may be unexpected. For best results, avoid merged cells in your data range.
Excel’s standard filter indicators will show which columns have active filters. Use “Clear All Filters” to remove all applied filters.
Yes! The formatting filters (Bold, Italic) work with both direct formatting and conditional formatting applied to cells.
Related Documentation
Smart Highlights - Essential Conditional Formatting Made Easy
Apply professional conditional formatting in Excel with one click. Highlight dup...
Read DocumentationFind Duplicates - Comprehensive Duplicate Detection & Management
Find, highlight, hide, and manage duplicate data in Excel with advanced detectio...
Read Documentation