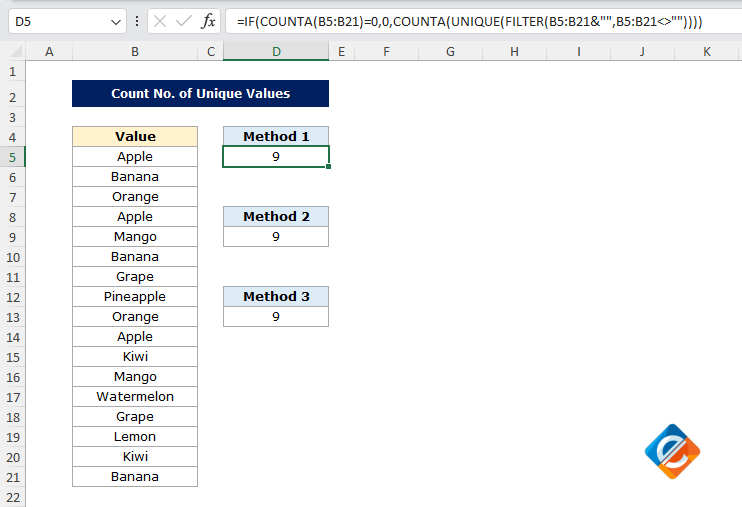
3 Methods: How to Count Unique Values in Excel
As you know, Excel is a powerful tool, but sometimes it can be confusing, especially when we need to perform a specific task such as counting the unique values. You can use the UNIQUE function to return the unique values, but let’s learn three different formulas to count unique values in Excel which will just return us the unique number.

Table of Contents
Why Counting Unique Value Matters
To count the unique values from your dataset is a crucial and most required task in data analysis. Assume you have a list of customers or products, and you need to find out how many unique entries are there. This could be very useful for inventory tracking, customer profiling, or even useful in financial reporting. Instead of manually checking, we can rely on a few Excel formulas to do the work for us. Below is a step-by-step guide with examples, so even if you are new to Excel, you can understand and use these formulas effectively.
Method 1: Formula Using IF, COUNTA, UNIQUE, and Filter (latest version of Excel)
=IF(COUNTA(A2:A100)=0,0,COUNTA(UNIQUE(FILTER(A2:A100&"",A2:A100<>""))))How It Works:
- COUNTA(A2:A100) checks if the range is empty. If the formula finds the empty cells, it will return 0.
- FILTER(A2:A100&””,A2:A100<>””) removes empty cells from the selected range.
- UNIQUE(…) then finds all the unique values from the filtered list.
- COUNTA(…) counts these unique values.
When to Use This Formula:
This formula is very efficient when you have blank cells in your dataset because it will filter the blank cells automatically and return only cells that have data. It is especially useful in newer versions of Excel (Excel 365 and Excel 2019), where the UNIQUE and FILTER functions are available.

With this dataset in range A2:A10, the formula will give us a result of 6, counting only the unique values: Apple, Mango, Orange, Banana, Grape, and Pineapple.
Method 2: Formula Using SUMPRODUCT and COUNTIF
=SUMPRODUCT((A2:A100<>"")/COUNTIF(A2:A100, A2:A100&""))How It Works:
- (A2:A100<>””) checks and ignores the non-blank cells.
- COUNTIF(A2:A100, A2:A100&””) counts each value’s occurrences in the selected range.
- The division operation helps count only the unique values by ignoring the duplicates.
When to Use This Formula:
This formula works in all the versions of Excel, so it is a perfect solution for those using older versions of Excel like Excel 2016 or 2013.

With the same dataset as above, the formula will return 6 as the unique count.
Method 3: Formula Using SUM and COUNTIF
=SUM((A2:A100<>"")/COUNTIF(A2:A100, A2:A100&""))How It Works:
- Similar to the SUMPRODUCT formula, this one also uses (A2:A100<>””) to ignore the blank cells.
- The COUNTIF part counts occurrences, and the division by COUNTIF counts only the unique items.
- Wrapping it in SUM finalizes the calculation, returning the unique count.
When to Use This Formula:
This formula is also compatible with all versions of Excel and is a handy alternative if you want to use SUM instead of SUMPRODUCT.
Sample Dataset
To test these formulas, you can create a dataset with common examples like product names, employee names, or any list with duplicate values. Download a quick example below:
Try the formulas with the above dataset and see how each of the formulas gives you the unique count.
Understanding the Output and Common Errors
- Blank Cells: These formulas ignore the blank cells automatically, so you don’t need to worry about empty rows and columns.
- Duplicates: The formulas ignore the duplicates, so the output is accurate for the unique values.
- Errors in Older Versions: If you are using Excel 2016 or earlier versions, the first method will not work because the UNIQUE and FILTER are not available. Consider using Method 2 and Method 3 in such cases.
Tips to Make Counting Unique Values Easier
- Use Named Ranges: If you are working with long datasets, assign a name to your range (e.g., Products). This way you can replace A2:A100 with Products in your formulas.
- Dynamic Ranges: Use Excel’s structured references if your data contains a table. Formulas will automatically adjust as rows are added or deleted.
- Copy-Paste Values: After getting the result, you can copy-paste the result as a value if you don’t need it to update with the changes in the data.
Conclusion
Counting the unique values is a powerful trick in Excel that can simplify the data analysis. Using the above-mentioned formulas, you can easily find the unique counts in any of the datasets. Play around with these formulas and test them on different datasets. Trust me, once you get the hang of it, Excel will feel like a breeze!
